Audit Logs
View and monitor system activity logs and user actions.
Workflow Overview
🏠 Home > ⚙️ Control Center > 📋 Audit Logs
Layout
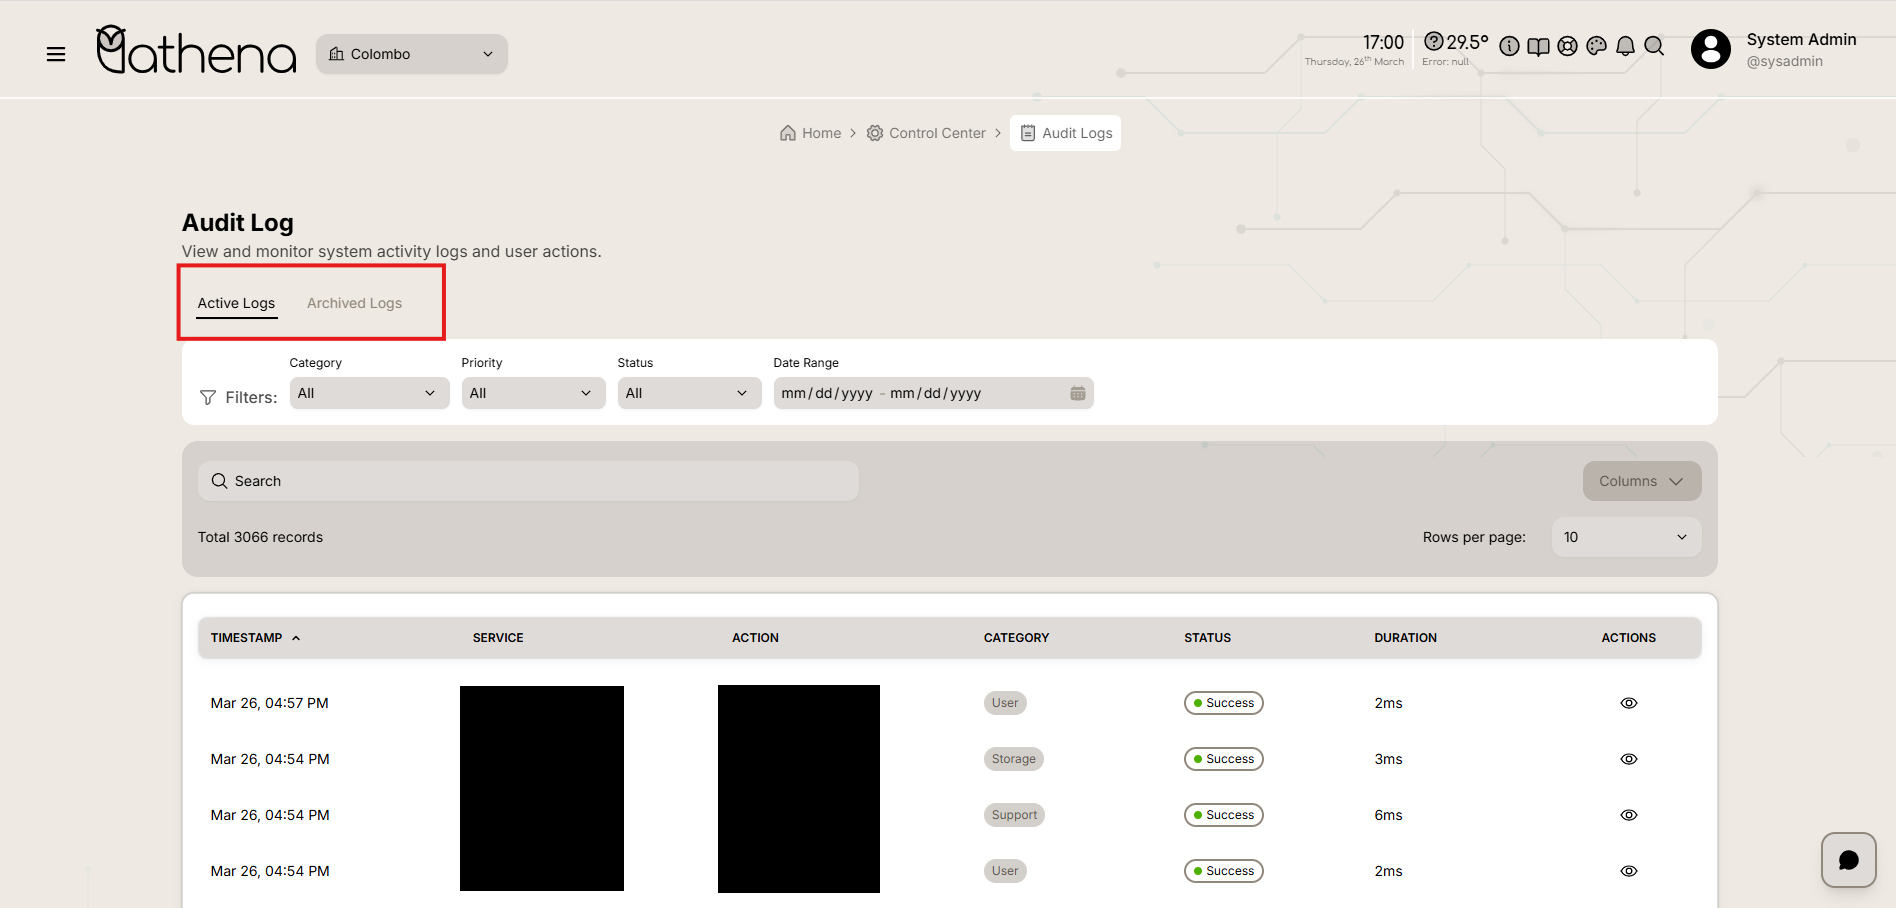
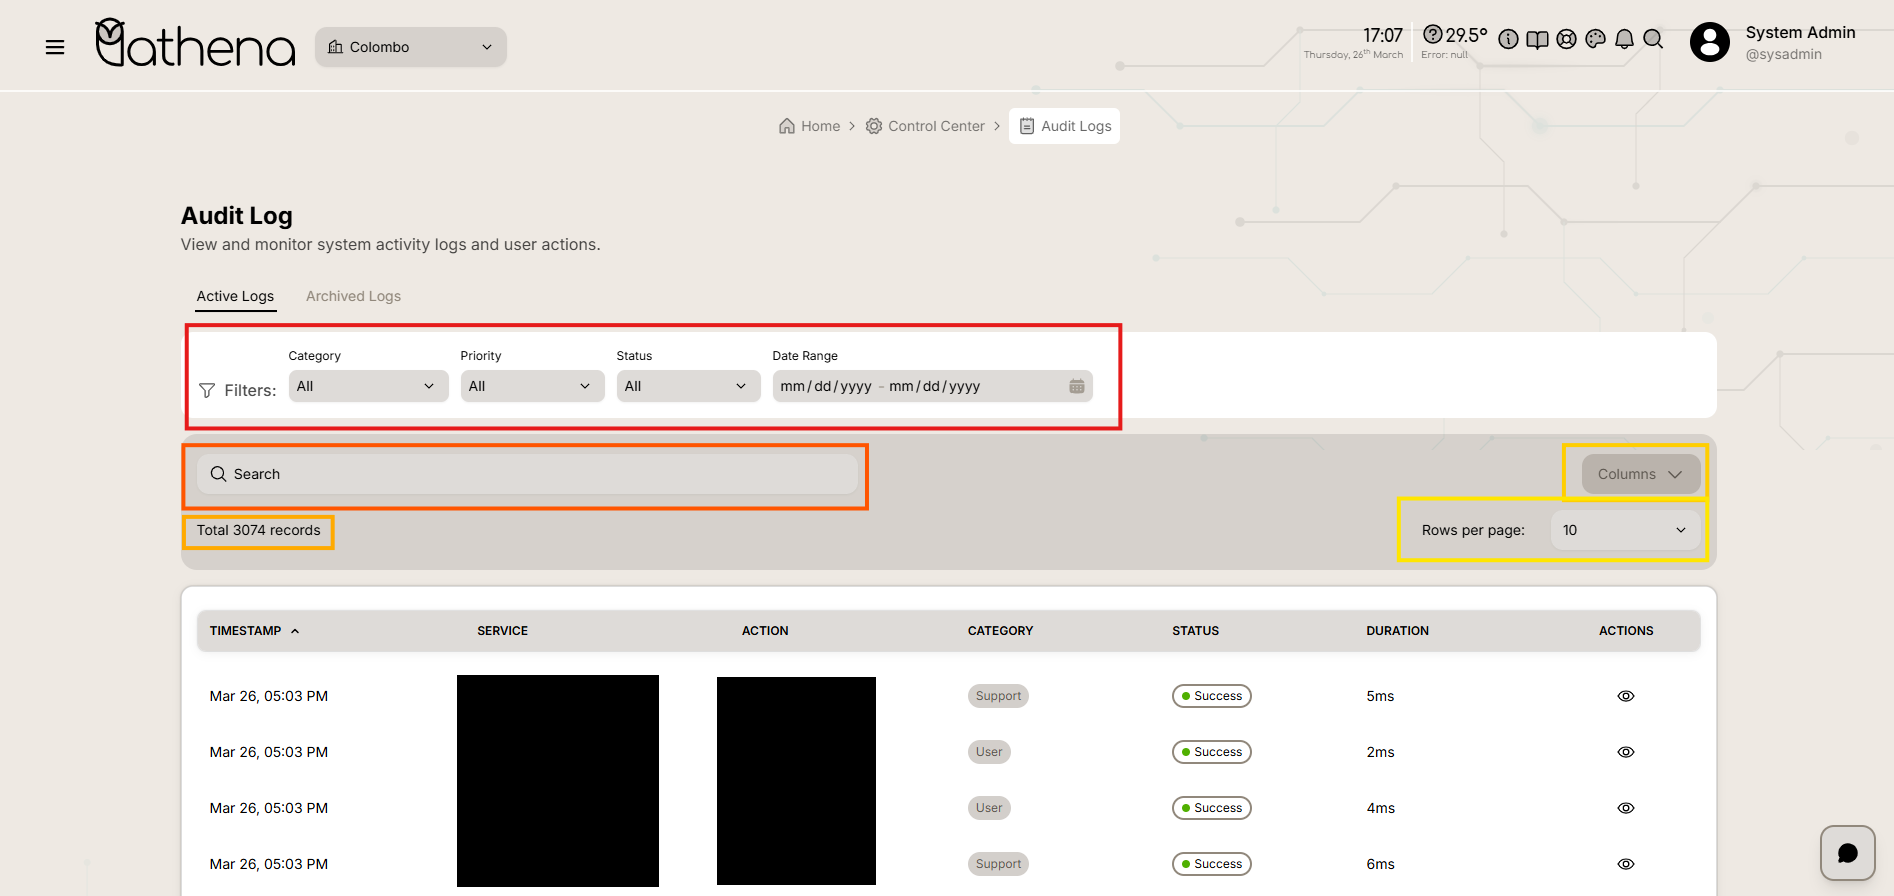
Audit Logs Tabs
-
Active Logs - View recent and current system activity logs.
-
Archived Logs - Access historical logs that have been archived for retention.
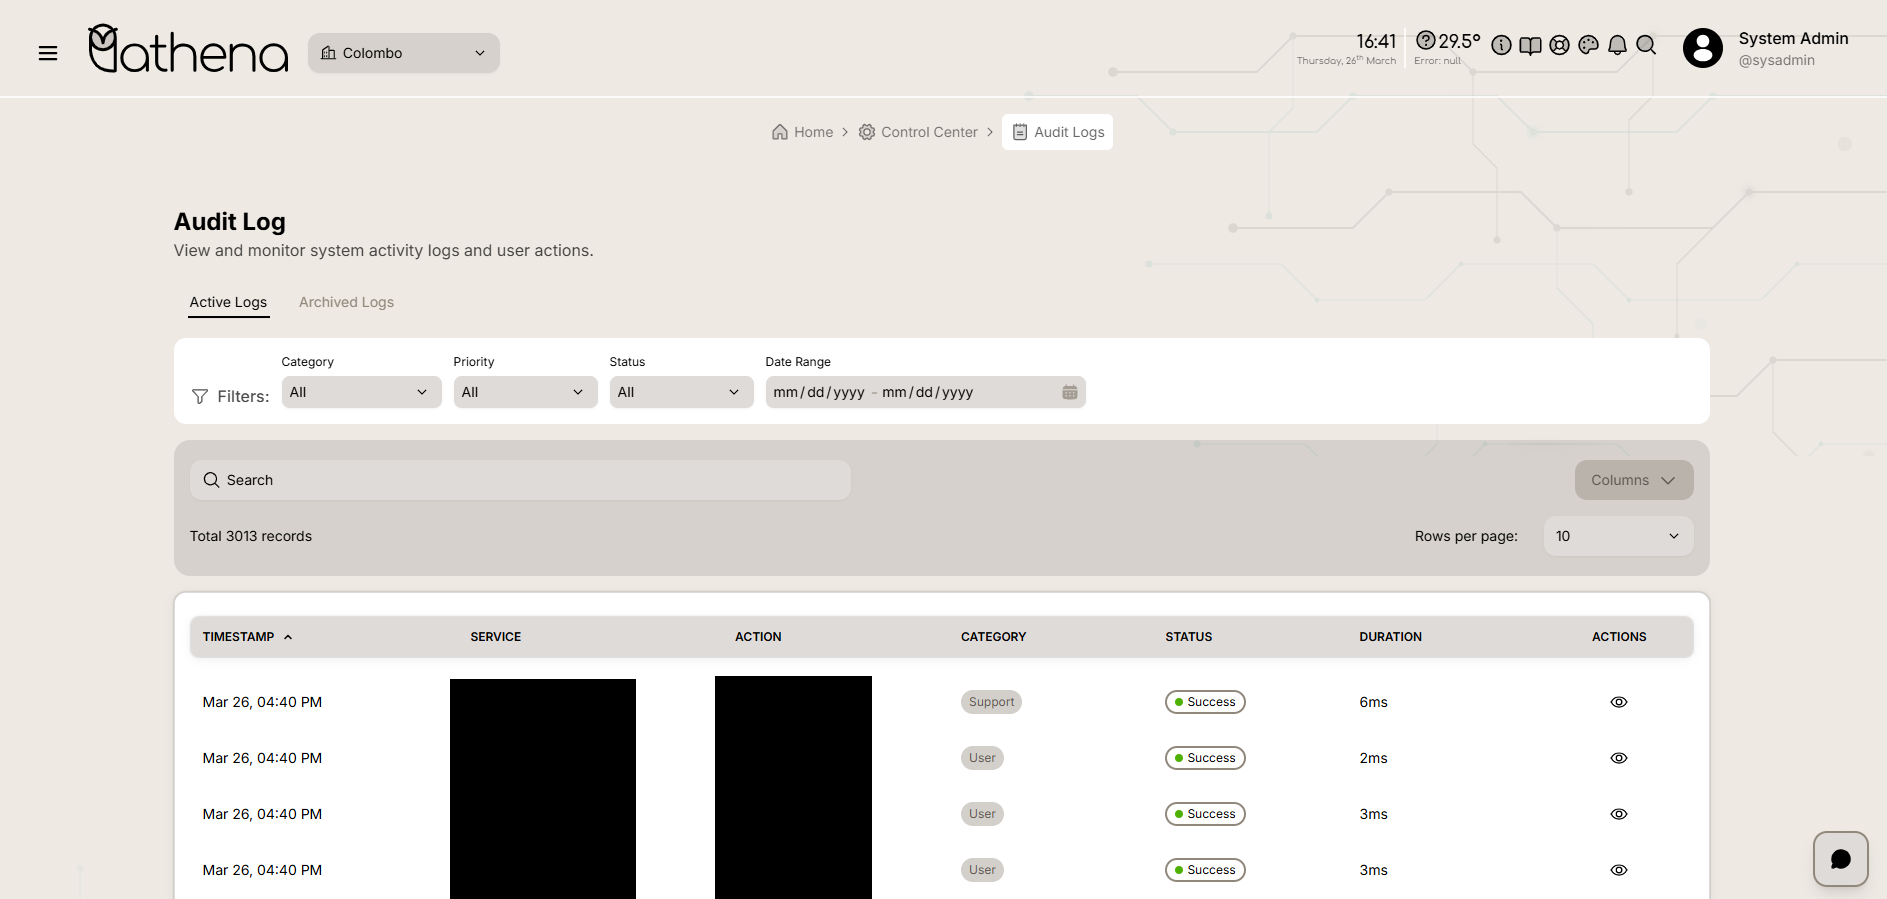
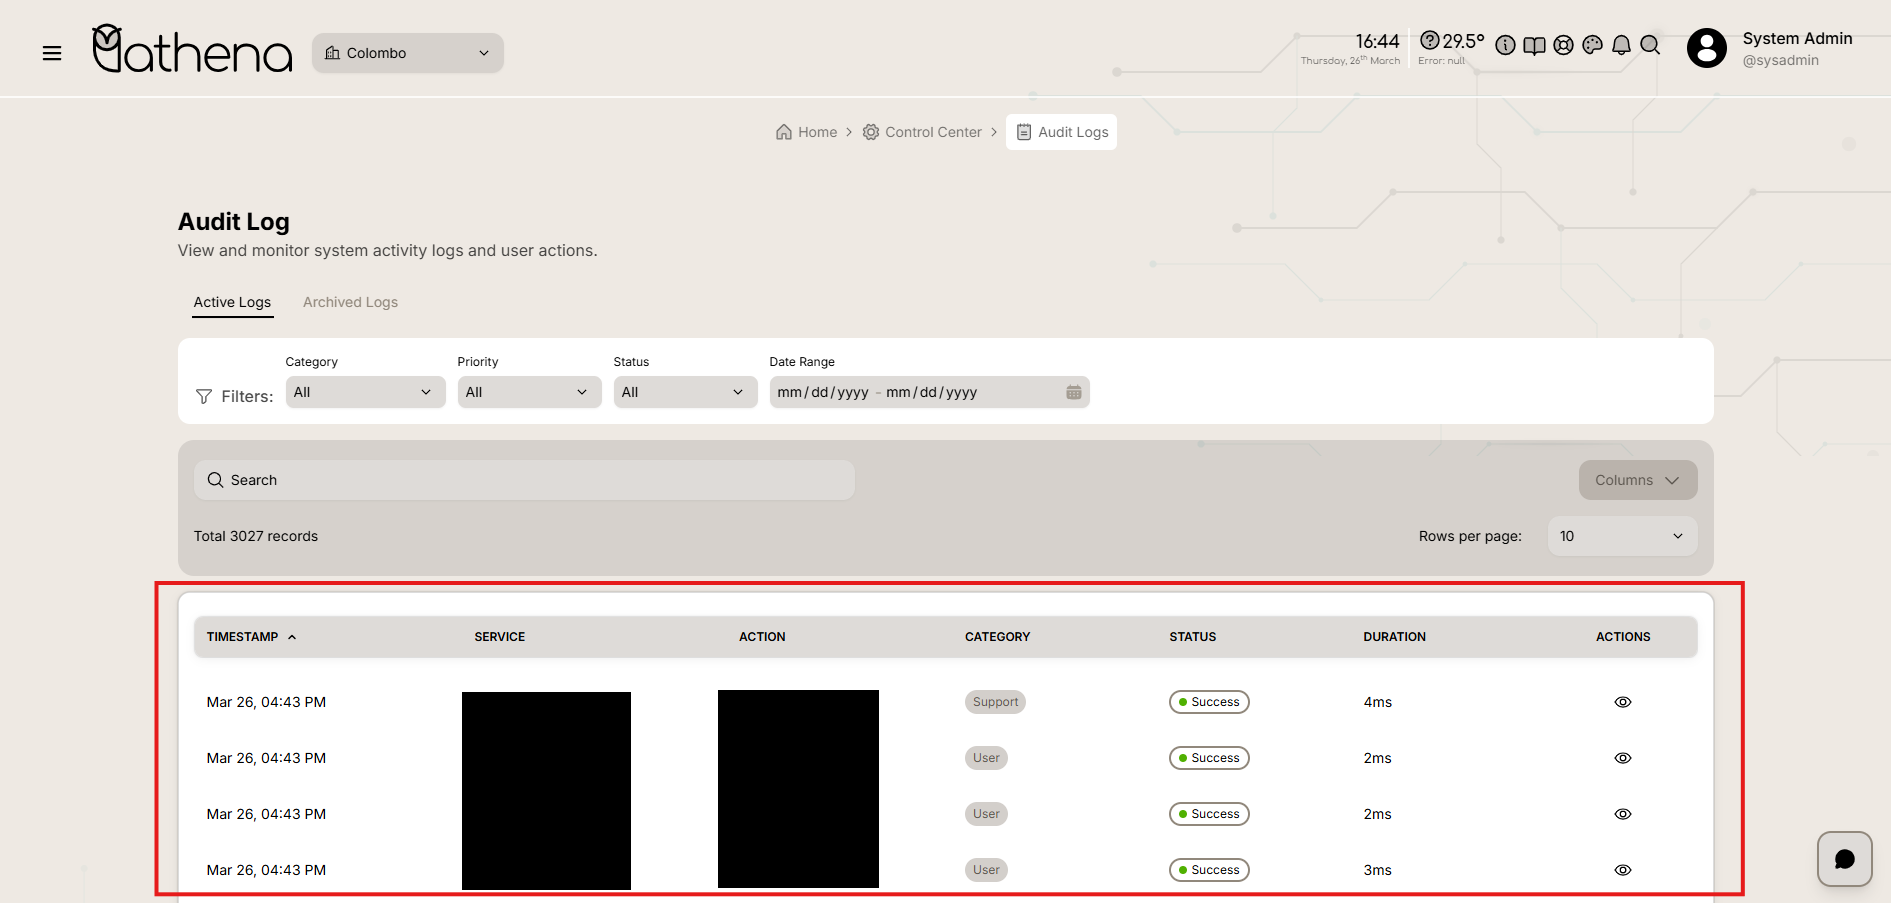
Audit Logs Table
-
Timestamp - Displays the date and time when the action was performed.
-
Service - Shows the controller or service that handled the request.
-
Action - Indicates the specific method or operation executed.
-
Category - Identifies the functional category of the action.
-
Status - Shows whether the action was successful or failed.
-
Duration - Displays the time taken to complete the action in milliseconds.
-
Actions - Provides options such as delete for individual log entries.
Audit Logs Actions
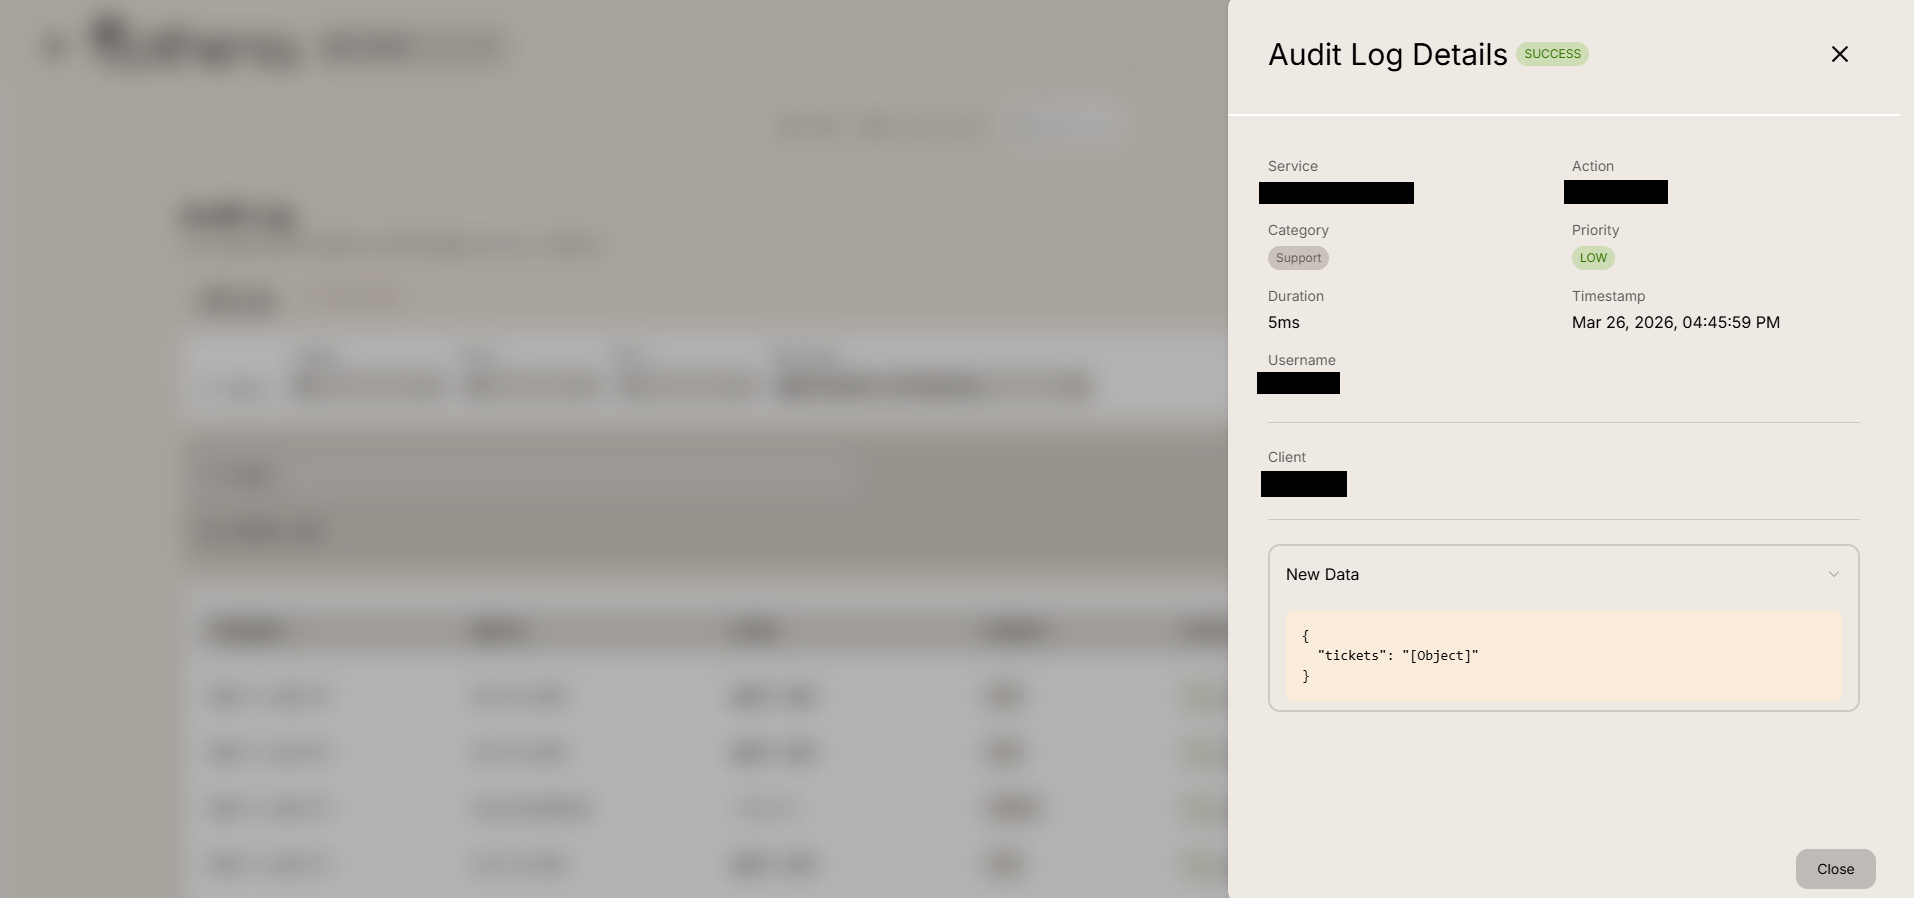
When clicking the view action, a detailed modal or page displays the complete log information.
-
Service - Shows the controller or service that handled the request.
-
Category - Identifies the functional category.
-
Duration - Displays the time taken to complete the action in milliseconds.
-
Username - Shows the user associated with the action.
-
Client - Displays client information or IP address, if available.
-
Action - Indicates the specific method executed.
-
Priority - Shows the priority level, such as LOW, MEDIUM, or HIGH.
-
Timestamp - Displays the exact date and time of the action.
-
New Data - Shows the JSON payload or data associated with the action, including user details, permissions, roles, and other relevant information.
Table Controls
-
Category Filter – Filter logs by system category such as Support, User, or Academic.
-
Priority Filter – Filter logs by priority level such as Low, Medium, or High.
-
Status Filter – Filter logs by status such as Success or Failed.
-
Date Range Filter – Select a custom date range to filter logs within a specific period.
-
Search Bar – Quickly filter and locate specific log entries by keywords or details.
-
Columns Management – Customize which columns are visible in the table view.
-
Records Count – Displays the total number of log records available.
-
Rows Per Page – Adjust the number of records displayed per page.
Key Features
-
Comprehensive Activity Tracking – Monitor all system actions including controller calls, user operations, and execution details.
-
Detailed Log View – Access complete log details including service, category, duration, username, client, action, priority, timestamp, and full JSON data payload.
-
Performance Monitoring – Track action duration to identify slow operations and optimize system performance.
-
Audit Compliance – Maintain detailed records of user actions, for security and regulatory compliance.